


One of our big aims is to reduce our emissions by doing things like:
- decarbonising our heating system using heat pumps
- producing onsite renewable electricity using solar panels
- recycling waste, water and the materials used in galleries
- encouraging the use of active and public transport by staff and visitors.
However, to do the above, we first need to understand what our emissions actually are. Therefore, every year (and very soon, every month!) we review all of the emissions that we have data for, to see how we are progressing against our strategy.
How to report on it
You might have seen other organisations report on their annual emissions and wonder to yourself, what does that include? And that’s a good question.
Emission sources can be divided into different categories. The largest category is Scopes, of which there are three:
- Scope 1: All energy used within an organisation. In our case that is the gas used by our boilers and the fuel used in company vehicles and in Gardens equipment.
- Scope 2: Purchased electricity, heat, or steam. The emissions from these occur from outside the organisation. In our case this is just our electricity usage.
- Scope 3: Everything else! For the Horniman, this includes our waste, water usage, business travel, staff commuting, visitor journeys, and materials used in our buildings, galleries and products sold in our shop and café.
Almost all organisations include Scope 1 and 2 when reporting emissions, but most don’t include Scope 3. This is because a large proportion of Scope 3 emissions are outside of their control, making them hard to measure and even harder to change.
At the Horniman, our net zero by 2040 target includes Scope 1 and 2 emissions, but not Scope 3. However, we do measure (or in some cases estimate or ‘model’) our Scope 3 emissions and report them alongside Scope 1 and 2.
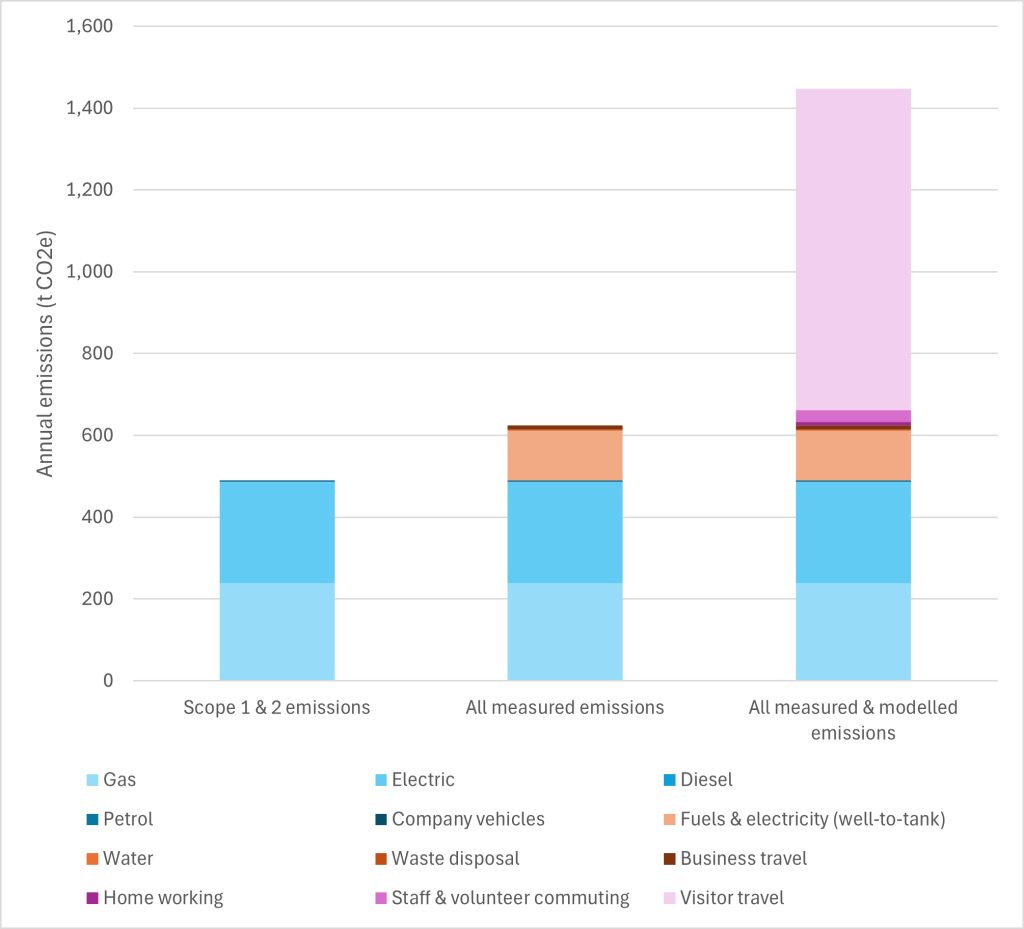
Horniman Museum and Gardens 2024-25 financial year emissions by emission boundary.
The state of things
In 2024-25 we generated about 490 tonnes of carbon dioxide equivalents (t CO2e). This is a measure used to normalise non-CO2 emissions such as methane and nitrous oxide against that of CO2 so that our total impact can be summarised in a single metric.
Our 490 t CO2e came from the combustion of gas in boilers and the generation and transmission of electricity, as well as tiny amounts of petrol and diesel fuel used in garden equipment. However, the Gardens equipment is now mostly electrified!
To get to net zero by 2040, we need to reduce these emissions by 33 tonnes every year.
If we include the emissions from waste, water supply, water treatment and business travel by staff, then our emissions rise to 625 t CO2e. Most of this increase is from including the extra emissions generated from extracting and refining the gas used in our boilers, and extracting and refining the fossil fuels (also mostly gas) used to generate electricity.
The biggest share of the chart (in purple) shows what happens to our emissions reporting when we include emissions sources that we can’t quite quantify yet, but that we can approximate using surveys and other information (i.e. modelled emissions). These total 1,447 t CO2e.
The largest source of what we are calling our modelled emissions is from visitor travel to the Museum. Car usage by visitors alone is estimated to account for almost the same amount of carbon dioxide equivalents as all the gas and electricity we use across our estate. Therefore, if you can, please Ditch the Drive and get to the Museum using active or public transport.
So, as you can see we have a big challenge ahead to reduce our emissions under every Scope. Figure 2 shows a few of the changes we have planned in Scope 1 and 2 over the coming years, to reach net zero.
Next steps
The biggest opportunity will be switching our gas fired boilers to Air Source Heat Pumps (ASHPs). We’ve already successfully implemented this at our offsite collections store.
Other opportunities include measuring and increasing the quantity of emissions taken up by the trees on our estate, which we currently estimate to be around 40 t CO2e every year.
Switching all our lights to LED will help to reduce our electricity consumption. Improving wall and roof insulation will reduce wasted energy while heating our buildings. Both will result in less wasted energy and lower emissions.
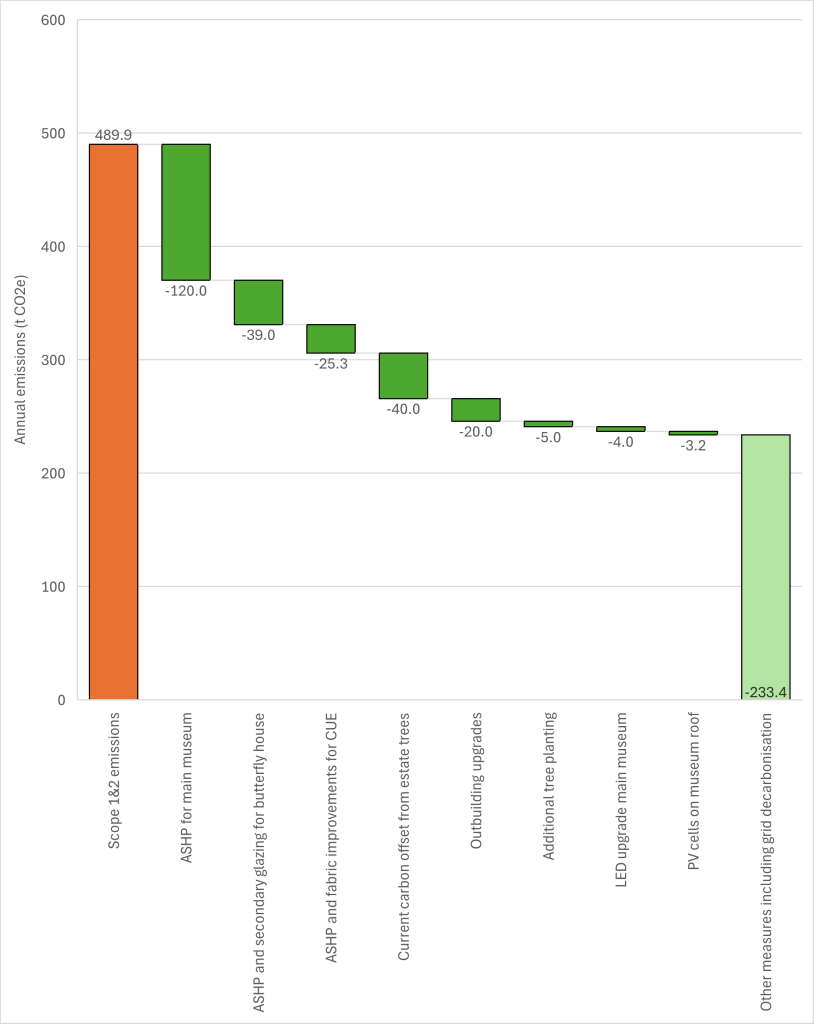
Measures planned to achieve net zero in Scope 1 and 2 emissions by 2040.
Have you thought about the types of emissions generated by your place of work? Would they look similar to ours? How would you go about reducing them if you had the opportunity?